.svg)


What is the ecological footprint?
The ecological footprint is a substantial sustainability metric, encompassing a person's total consumption of ecological ressources. The CO2 footprint also known as carbon footprint is part of this calculation and is acting as overall measure for the greenhouse gas emissions, which are directly or indirectly caused by activities of persons, products, companies or countries. For private persons, the following six aspects of emissions are used:
- Electricity consumption
- Heating
- Flights
- Transport
- Food
- Other consumption
Private individuals can calculate their own ecological footprint by using CO2 calculators, e.g. those by ClimatePartner. However, it must be considered that free CO2 calculators for private individuals can only estimate emissions and cannot provide an exact calculation. Nevertheless, CO2 calculators are interesting tools in order to raise awareness of private households regarding their emissions and encourage a playful engagement.
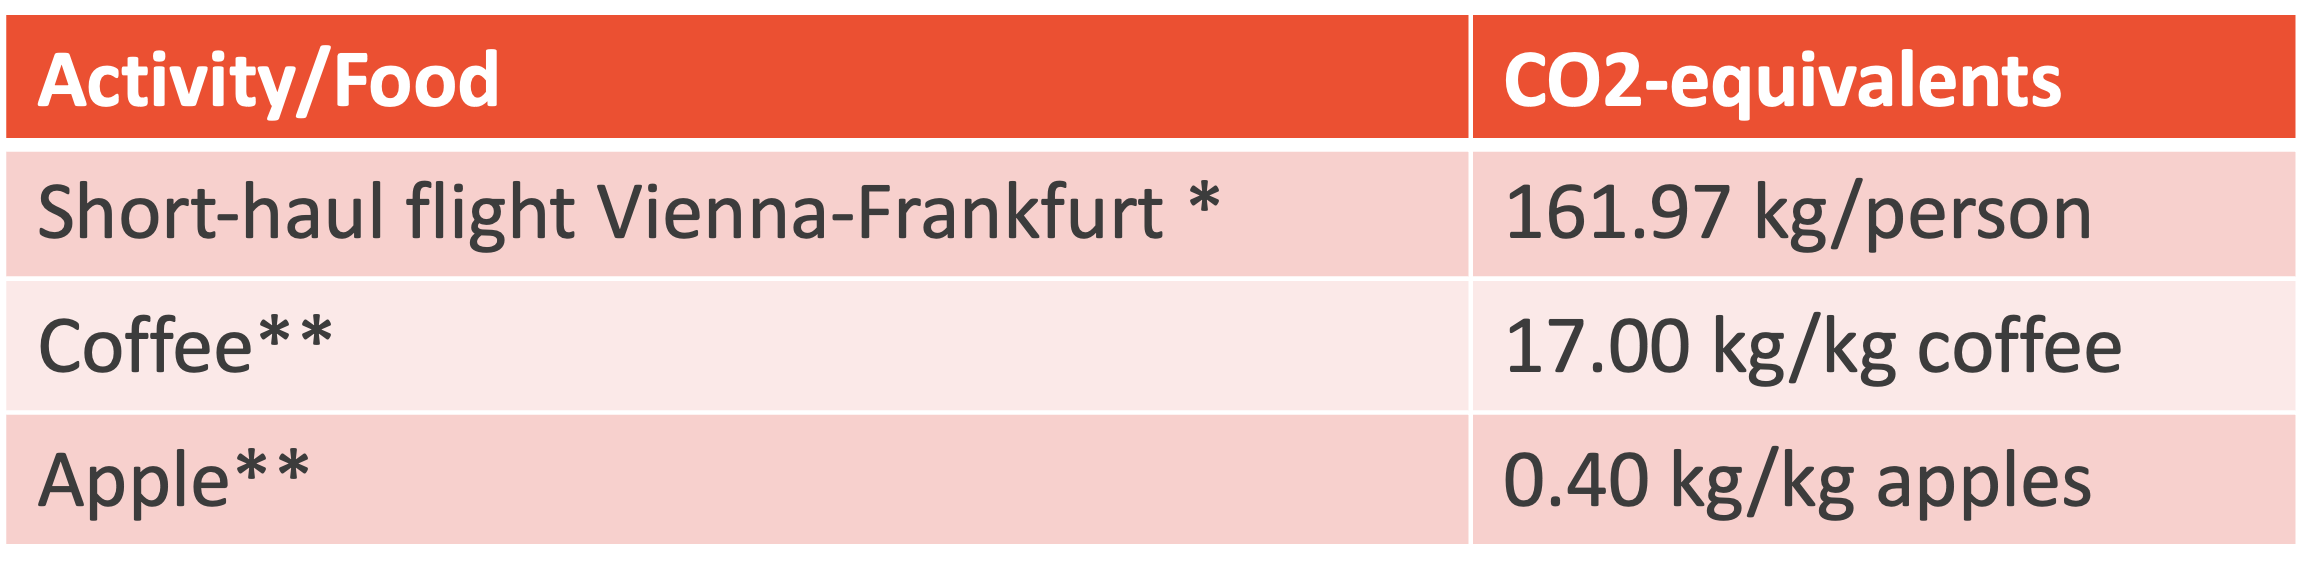 * https://de.statista.com/infografik/18952/treibhausgasemissionen-nach-verkehrsmitteln/, 12.09.2023 ** https://www.moment.at/story/wie-viel-treibhausgas-produziert-dein-essen-eigentlich, 12.09.2023
Companies balance their carbon footprint within the framework of a corporate carbon footprint calculation, which includes both direct CO2 emissions such as electricity, heating and cooling at the company locations as well as indirect emissions, e.g. through the purchase of new IT equipment or the commuting of employees.
 * https://de.statista.com/infografik/18952/treibhausgasemissionen-nach-verkehrsmitteln/, 12.09.2023
CO2 footprint in Europe
The average European produces about 8.7 tonnes of CO2 per year. The average Austrian, with 9 tonnes of CO2 per year, is already above this, the average German, with 8 tonnes of CO2, is slightly below. The average Swiss is the most economical with 4.40 tonnes of CO2 emissions. Switzerland is also a role model when it comes to new registrations of electric cars and installations of photovoltaic systems. Those who want to join the economical Swiss are well advised to install photovoltaic systems and battery storage units for sustainable energy use, as well as charging stations to facilitate the switch to electromobility. Since four out of six aspects addressed in the survey deal with energy production, use and mobility, one thing is already clear: those who rely on fossil energy sources and means of transport with combustion engines will not score well in terms of their ecological footprint.
The importance of the carbon footprint for private individuals and companies
Awareness raising for private individuals
The average CO2 footprint per resident varies by country and method of calculation. If emissions from imported but domestically consumed goods are included, the per capita footprint can be significantly higher – this is known as the "consumption-based CO2 footprint."
Calculating one’s footprint is a helpful awareness tool for individuals to understand which life areas contribute most to their emissions and where improvements are possible. However, fixating solely on the personal footprint overlooks impactful actions like career choices, political support, or sustainable investments.
Responsibility for companies
For companies, the Corporate Carbon Footprint involves responsibility. It is necessary to establish a baseline, identify areas in the company that cause particularly large greenhouse gas emissions and derive short-, medium- and long-term reduction measures from them. The Corporate Carbon Footprint, which is calculated annually, allows changes in the company to be assessed against these reference values and to be continuously redefined. In the long term, there is no way around sustainable business models for companies that support private individuals, other companies and the public sector in shaping a future worth living.
Why is the Corporate Carbon Footprint important for companies?
1 Clarity
The Corporate Carbon Footprint can be quantified with a concrete number. The primary purpose of a Corporate Carbon Footprint is to provide clarity regarding how many emissions are generated in which area of a company.
2 Responsibility
The clarity about the CO2 emissions in the company makes it possible to derive reduction and subsequently compensation measures from it and thus to take responsibility for the emissions caused in the company.
How neoom integrates sustainability in the company
3 Transparency
The carbon footprint is a key figure that describes an area of sustainability. This enables companies to communicate transparently about sustainability with customers and potential employees.
4 Competitive advantage
In times of climate crisis, the urgency for action in the field of sustainability increases. The Corporate Carbon Footprint (CCF) is currently still voluntary, but the requirements of the legislator are increasing. The CCF therefore already offers the advantage of being a pioneer compared to competitors.
How is the Corporate Carbon Footprint calculated?
The GHG (Greenhouse Gas Protocol) specifies the calculation method for the Corporate Carbon Footprint. The globally recognised method is divided into 3 scopes, with minimum requirements prescribed in the calculation as well as possible extended calculations.
SCOPE 1
measures directly generated emissions from company-owned facilities or vehicle fleets.
SCOPE 2
includes purchased energy.
SCOPE 3
includes indirect emissions such as the employees' commute to work or purchased services.
For most calculations, only Scope 1 and Scope 2 emissions are mandatory. However, this falls short, as for many companies Scope 3 can cause up to 90% of the actual emissions. This includes, for example, business travelling such as flights, train journeys and rental cars, but also employee travelling or purchasing IT equipment.
It follows from these different calculation methods that calculations of corporate carbon footprints do not create comparability between companies, but rather a company can only compare with itself.

How neoom integrates sustainability
neoom's products support companies in reducing their Scope 1 and Scope 2 emissions: Charging stations facilitate the switch to e-mobility and thus reduce direct emissions from the vehicle fleet. A photovoltaic system in combination with a battery storage device reduces the amount of purchased electricity and increases the share of sustainable energy sources in the company's power supply. Another option is to join a renewable energy community and purchase regional electricity from the community. These measures are often easy to implement and economically advantageous first steps for companies to reduce their corporate carbon footprint.
Since it is important to work with partners who pursue the same goal, the corporate carbon footprint of suppliers and service providers should not be ignored.
Corporate Carbon Footprint of neoom
The Corporate Carbon Footprint has been recorded annually at neoom since 2021. In our Corporate Carbon Footprint calculations, we have used Scope 1, Scope 2 and some categories from Scope 3. Scope 3 includes indirect emissions - we have included these in the calculations to obtain a more comprehensive result. According to the minimum standards, these are usually not included at all.
In Scope 1 and 2, we have taken into account emissions caused by electricity consumption, heating and cooling requirements and vehicle fleets. Scope 1 includes direct emissions from company facilities. Scope 2 includes indirect emissions from purchased energy.
Scope 3 includes our emissions from travelling by train, flights, company private vehicle use, home office, hotel accommodation, IT (electronic devices), emissions from employee commuting, use of external data centres for our energy management system and fuel and energy-related upstream chain emissions for electricity, heating and vehicle fleet.
In terms of percentage, at neoom, Scope 3 emissions make up 99.8%, Scope 2 emissions 0% and Scope 1 emissions 0.1% of our total Corporate Carbon Footprint 2023.

neoom's 2023 CCF covered headquarters in Freistadt, Vienna, and Nuremberg. Localized footprints enable tailored reduction efforts. Most emissions came from Scope 3, particularly from the energy-intensive manufacturing of PV modules and batteries by partners. Although production emits CO2, neoom’s solutions save far more emissions over their lifespan—4 to 6 times more over 20 years.
The Vienna office is in the LEED Platinum-certified ICON Tower, offering energy efficiency and excellent public transit access. The Nuremberg office is in a climate-neutral shared workspace.
In Freistadt, 85% of the vehicle fleet is electric, with 2 million km driven electrically in 2023. neoom moved into the new Free City building in 2023, a fossil-free, high-standard DGNB “Platinum” certified site.

In 2023, we moved into a new building - the newly constructed Free City. The building is not only a beacon project for energy transition, which is operated completely without fossil energy, but was also constructed according to high sustainability standards and is currently striving for the highest level of the DGNB (Deutsche Gesellschaft für Nachhaltiges Bauen - German Sustainable Building Council) certification "Platinum".
The most important key figure for neoom in the CO2 balance is the CO2 footprint per employee. This figure enables comparability from year to year despite changing company size and was 6.6 tonnes per employee 2021. In 2022, it increased slightly to 7.0 tonnes per employee due to the growing vehicle fleet and increased kilometres travelled. Even if the path to this goal is not always straightforward, it is clearly our goal to reduce CO2 emissions per employee.
Reducing the CO2 footprint: neoom shows how it's done
One thing is clear: For neoom, the topic of CO2 reduction comes first. Therefore, based on calculations, we derive measures to reduce our footprint and thus achieve a real added value for climate protection. The goal is to convert the main source of CO2 emissions, the vehicle fleet, to 100% e-mobility by 2030. The PAVE Commute app has been introduced for employees' commutes, promoting and rewarding sustainable employee mobility. More information can be found on our sustainability website.
However, as unavoidable emissions are always included in a corporate carbon footprint and we already want to make a positive contribution, neoom has decided to strategically anchor CO2 compensation through climate protection projects. An approach that is also recommended by the UN.
In the neoom reduction and compensation strategy, action is taken on several levels. At neoom, the entire emissions of the CCF are offset. For this purpose, the neoom Carbon Portfolio was launched in 2022. With our certified climate protection projects, we do justice to the social dimension of sustainability by ensuring that the projects make an important contribution to achieving the UN goals (SDGs) for long-term peace and prosperity. 11 of the 17 UN goals are promoted with our projects. A high diversity of climate protection is possible due to audited projects with innovative partners around the world. Both technological and social aspects are supported in the projects. In addition, our investment in CO2 certificates helps to close the financing gap for sustainable development in developing countries and to implement the design of ecological systems.
>> Overview of all 10 climate protection projects
Corporate Carbon Footprint: FAQs
1 Corporate Carbon Footprint vs. Product Carbon Footprint - what is the difference?
The Corporate Carbon Footprint balances the CO2 emissions from energy use at the company premises (electricity, heating, cooling and vehicle fleets) and can cover the entire business activity. At neoom, the CCF includes site and employee-related emissions - the hardware products are currently not included. The Product Carbon Footprint calculates the CO2 emissions over the life cycle of a product. neoom is currently conducting a research project on the Product Carbon Footprint of neoom battery storage devices with a university of applied sciences.
2 What are the major CO2 generators?
The major CO2 generators at neoom are cars with combustion engines, although they only make up 25% of the vehicle fleet.
3 What is the average CO2 footprint in Austria?
The average CO2 emissions per person are estimated at 8t/year.